Mrs Blanchard
Year 12 homework half term
Please remember homework is in folder 5 on the shared drive under AS Mrs Blanchard population
there is a guidance sheet in the folder and the homework is differentiated by target grades
Please watch the video identified on the guidance sheet first
HAVE a LOVELY HOLS
Mrs B
homework
https://www.ted.com/talks/hans_rosling_on_global_population_growth
enjoy!
Thursday
Good Luck tomorrow buddies
I like this link to hydrographs
Wednesday
http://geographyfieldwork.com/SpearmansRank.htm
Tuesday
Monday
Didn't look too bad to me :)
good luck with rest of exams
Sunday
Good Luck tomorrow
remember timing is crucial
Make sure you read and answer the question set not a random question
Do not forget your conclusions on 15 markers
You are cracking geographers .. make sure the examiner knows that :)
xxxx Mrs B xxx
Saturday
Demographic ageing in the UK
Demogrpahic ageing is one onf the greatest challenges facing the UK today. The demographic trends predict that by 2050 the propportion of the population aged 65 years and ver will have almost doubled. the main impacts will be on healthcare, pensions and housing. The UK government predicted in itsmost recent review that:
· The ratio of people 65 years and over to those aged 20-64 will rise from 27% in 2001 to 48% in 2050. This marks a considerable change from the very slow increase in the previous 20 years.
· Average male life expectancy at 65, which rose from 12.0 years in 1950 to 19.0 years in 2001, will increase further by 21.0 by 2030 to 21.7 by 2050. Female life expectancy is higher, but will increase at a slightly slower rate
· The current low fertility rate of 1.7 children per woman will increase only slightly to 1.75 by 2025, levelling off thereafter
The 2001 census enumerated more than 1.1 million people ages 85 and over. There were more than 300,000 aged 90 or more. Life expectancy is influenced by socioeconomic class and by ethnic group.
Ageing and health
An ageing population places increasing pressure on health reosurces but it is important not to overstate the this impact. Average healthcare costs do rise with age, but the cost ofthis tend could be significantly offset by people becming healthier. Retired people continue to pay income tax and other taxes. Health costs tend to be compressed into the last years or even months of life - a process termed the compression of morbidity.
Ageing and pensions
The state pension system transfers resources from the current generation of workers to the current generation of pensioners. As the population has aged the level of resource transfer required has increased. The system cannot by sustained in the future without significant change. Four options have been suggested:
· Pensioners become poorer relative to the rest of society
· Taxes and National Insurance contributions devoted to pensions increase
· The rate at which individuals save for retirement increases
· The average retirement age increases
The grey pound - the money spent by people who are retired:
· In the tourist industry, cruising is a popular type of holiday with this age group
· Some companies for example Saga, provide a wide range of leisure services for older people, in this case the over 50s
· Some companies, for example B&Q and Homebase, target this age group for their workforce
· The growing number of elderly people who live alone has led to the provision of a range of support services, such as health visitors, meals on wheels, home-help cleaners and drivers for hospitals visits
Ageing and housing
As people get older they get more and more segregated by society. Segregation baed on age has manifested itself in a number of ways in thwns in the UK:
· On council areas there a clusters of purpose-built bungalows occupying one small part or parts of the estate – still be part of the community
· Sheltered accommodation – overseen by a warden or manager – flats or bungalows
· On council areas there a clusters of purpose-built bungalows occupying one small part or parts of the estate – still be part of the community
· Sheltered accommodation – overseen by a warden or manager – flats or bungalows
· Nursing homes – increasing in number to cater for the growing number of elderly people. Can be a combination of council funded and private developers
Friday
Population structure
The composition of a population according to age groups and gender is known as the age-sex structure. It can be represented by means of a population pyramid.

Population pyramids
The vertical axis of a population pyrmaid has the population in age bands of 5 years and the horizontal axis shows that number or % of males and females. The pyramid shows longevity by its height.
Population pyramids can show:
· The results of births minus deaths in specific age groups
· The effects of migration
· The effects of events such as war, famine and disease
· An indication of the overall life expectancy of a country
Age structure can also be measured by a number of indices:
· The dependency ratio
· The support ratio
· The juvenility index
· The old-age index
The dependency ratio shows the relationship between the economically active (working) population and the non-economically active (dependent) population
Thursday
Answer booklet from todays's lesson on S Drive
Revision today
France pro natalist policy
In most developed countries, the decline in fertility and the increase in life length has raised three concerns:
- A decrease in the supply of labour.
- The socioeconomic implications of population ageing.
- The long term prospect of population decline and demise.
The French Policy
In 1939, the French passed the “Code de la famille”, a complex piece of pro natalist legislation. The pro natalist methods in the policy included:
- Offfering cash incentives to mothers who stayed at home to care for children.
- Subsidising holidays.
- Banning the sale of contraceptives (repealed in 1967).
Incentives offered in the policy included:
- Payment of up to £1064 to couples having their third child.
- Generous maternity grants.
- Family allowances to increase the purchasing power of three child families.
- Maternity leave on near full pay for 20 weeks for the first child to 40 weeks or more for the third child.
- 100% mortgage and preferential treatment in the allocation of three bedroom council flats.
- Full tax benefits to parents until the youngest child reaches 18.
- 30% fare reduction on all public transport for three child families.
- Pension schemes for mothers/housewives.
- Child-orientated development policies e.g. provisioning of creches, day nurseries etc.
- Depending on the family’s income, childcare costs from virtually nothing to around €500 a month for the most well off of families.
- Nursing mothers are encourage to work part-time or take a weekly day off work.
Essay
France’s population is entering an increasingly critical state due to a rapidly decreasing support ratio, a low fertility rate and a falling birth rate. An increasing proportion of France’s population is now over the age of 60, whilst there are fewer economically active people and even fewer people having children. This presents an economic problem as the economically active people must pay taxes towards the pensions of the older population and towards social care, which helps care for the elderly. With less young people in work, there’s less money funding the elderly which will, eventually, lead to a decline in the standard of care which the elderly can receive, simply due to a lack of funds. Currently, over 21% of France’s population is over 60 and it’s predicted that by 2050, ⅓ of the population will be over 60. The economic impacts of this low support ratio are huge. It’s currently costing the French government €12.9 billion to pay for the social security & health care of the elderly due to the large proportion of old people to employed young people. Since 1901, the support ratio of France has fallen a large amount. In 1901, the support ratio was 7.8 persons aged 15-64 to one person aged 65 years or older. In 1950, this number had fallen to 5.8, largely as a side effect of the two world wars. By 1995, the ratio had fallen to just 4.4 young people to one old person.
In addition to the rapidly decreasing support ratio, France’s population also faces the problem of a falling birth rate & low total fertility rate. The fertility rate of France in 1960 was 2.75 children per woman, well above the replacement level of 2.1. However by 1992 the total fertility rate had fallen to 1.67, substantially lower than the replacement level. This low fertility rate is due to an increasing proportion of educated women who are pursuing careers. Today, 81% of women in France are employed. Women are now focusing on their careers rather than on raising families, resulting in women putting off having children until they’re 30 or deciding to just not have children, especially middle class women. This has the effect of lowering both the fertility rate and the birth rate to levels below replacement level, resulting in smaller successive generations. This, combined with an ageing population, presents the problem of a low number of economically active individuals in the future, resulting in a decreased support ratio and raising costs to care for the elderly which ultimately increases the strain on France’s treasury.
In order to combat the falling fertility rate, France has employed an aggressive pro-natalist policy which employs a system of monetary incentives and rewards for women giving birth to multiple children which seems to have helped raise France’s total fertility rate to 1.98, the second highest in Europe next to Ireland, but still below replacement level. In 1939, the French government passed the “Code de la famille”, a complex legislation that introduced a set of pro-natalist policies in order to attempt to improve France’s flailing fertility rate. One of the key aspects of the legislation was a series of incentives offered to working women, in order to encourage them to have children. The legislation introduced a long maternity period of 20 weeks to 40 weeks depending on the number of children the woman has already given birth to. In addition to the long maternity leave, women also receive full pay during the maternity period, the idea of which is to ensure that women don’t lose out on their careers should they have children. In addition to fully payed maternity leave, the legislation also introduced a series of generous grants to women having children, especially multiple children. When a women has her third child, the French government will pay her up to €1,000 per month, depending on how well off she already is, as a reward. This is just €200 less than the French minimum wage. This, combined with next to free public transport (families are given a “large family card”, halving metro costs), €174 a year for extra-curricular activities and free entrance to public swimming pools and other public facilities, essentially means that the poorest families in France can raise a child for virtually nothing and the most well off can raise one for around €500.
In addition to grants and discounts on public services, the French government also offers subsidised state run childcare for children of 3 months, again, ensuring that women can continue to work after giving birth with minimal financial penalties. The level of subsidisation works on a scale of €0 to €500 a month, again, depending on the family’s income. Families also receive full tax subsidisation until the youngest child reaches 18, further reducing the financial impact of having multiple children. Finally, for when women reach retirement age, the French government offers full pension schemes for mothers of multiple of children.
Recently, the French government announced plans to raise the retirement age from 60 to 62 (by 2018) in an attempt to increase the support ratio by reducing the number of people who are classed as elderly. In addition to the increased retirement age, people will need to work 41.5 years in 2020 to claim a full pension versus the 40.5 years they must work now.
The code de la famille has evolved a lot since it was initially introduced in 1939 and continues to do so today in order to further improve the fertility rate. In 1967, for example, an aspect of the legislation which banned the sale of contraceptives was removed, likely due to contraceptives' effectiveness at stopping the spread of STDs.
The critical questions regarding the code de la famille is if it has been successful so far and if it will continue to be successful in the future. The legislation is costing the French government massive amounts of money to fund, which is increasing the strain on the treasury further. If the legislation was to fail, it could bankrupt the country. Opinions on the success of the policy vary wildly. The pro-natalist policy is politically neutral and all parties of the French government support it and most will call it a success. The ex-Prime Minister, Dominique de Villepin claims that baby booms and immigration will help to make “France the most populous country in Europe by 2030.” Despite the optimistic approach, he provides no evidence to support his claim. The UN estimates that France’s population will be 69.2 million by 2030 (it’s currently 64.8 million people) and 69.8 million by 2050. Germany’s, on the other hand, is estimated to be 77.9 million by 2030, casting doubt on the ex-Prime Minister’s statement. This is significantly below the French government’s goal of 75 million which suggests that, at the moment, the pro-natalist policy is not going to have the desired effects. There are currently no predictions available for the total fertility rate however given it’s current trend of increasing, it could surpass replacement level by 2050 assuming there are no unexpected events such as wars or famines.
Looking at data currently available regarding France’s population, the code de la famille would hint at success. Frances fertility rate has risen from 1.67 in 1992 to 1.98 today and, whilst this is still below replacement level, it indicates that the code de la famille is raising the fertility rate as desired. However, the cost of this pro-natalist policy is diminishing its success. Given France’s current budget deficit of 7.5% its GDP and the current situation regarding the euro, the country could struggle to fund the pro-natalist policies in the near future, which could limit its success and ultimately result in the policy failing, worsening the issue of paying for the elderly’s social care.
There is evidence to suggest that some of the improvement in Frances fertility rate is due to immigration and not due to the pro-natalist policy. When immigrants arrive in France, they are generally young and of child bearing age which could be causing the improved fertility rate instead of the pro-natalist policies. However, France’s net migration rate is only 1.46 migrants per 1,000 of the population which wouldn’t be high enough to effect the total fertility rate to the extent it has been.
Overall, the success of the policy is debatable. The policy is costing the government billions of euros on top of what it is costing the government to support the ageing population. The UN is predicting that the population will not increase to the desired amount and analysts predict that France will not be able to raise the fertility rate above the replacement level. The French government, on the other hand, argues that they will reach their goal of 75 million by 2050 using data collected by the itself. It’s difficult to tell whether the French government’s data is truthful however as, if the pro-natalist policy is not working, it could be damaging to the government’s integrity revealing this. Judging by the available data though and the predictions put forward by the UN, it would seem that the policy is going to receive little success. The population will only increase by 0.6 million between 2030 and 2050 and the fertility rate is not expected to exceed the replacement level. This, combined with the high cost makes the population seem relatively unsuccessful in the long run.
Wednesday
Population revision
one child policy
http://www.bbc.co.uk/schools/gcsebitesize/geography/population/managing_population_rev3.shtml
1950 the population of China was 0.6 billion and the state’s philosophy was that birth was a valuable addition to national resource and power.
In 1970 China realises that high population growth is unsustainable. The 'Later, Longer Fewer' policy is introduced. This encourages parents to delay their first child, allow a longer interval between births and have fewer children in total.
By 1975 the BR was at 33/1000; the population was at 0.9 billion and the government realised that if unchecked then the rapid growth would lead to famine and starvation. The two main reasons therefore were:
- The Chinese wanted to avoid a Malthusian type disaster;
- China could only have a rising standard of living if the population was controlled
When was it introduced?
1981 saw the introduction of the policy, based on a letter from the government to the Communist Party,
How was it instigated?
It was ‘encouraged’ in several ways;
- strong pressure was put on woman to use free contraception;
- special family planning workers in every work place;
- ‘granny police’ in housing areas instructed to make sure woman were practicing contraception and to report pregnancies;
- Enforced abortions and sterilisation became common
- Later marriages were encouraged
Yes it was in urban areas, but less so in rural where disobedience was common, an unforeseen ‘side effect’ was female infanticide; and the dominance of male babies led to the ‘little emperor’ syndrome
1990 onwards;
Saw the relaxation of the policy; it was difficult to enforce and the government was concerned with the ‘greying’ of the population. Also social influences from the West was increasing with the increase in global communications. However in remote areas the policy was still encouraged, the state of Guangdong ordered 20,000 abortions and sterilisations by the end of 2001 in the mountainous region of Huaiji
2007 population was 1.3 billion, but without the policy it would have been 25% higher, nearly 1.8 billion,
The BR was at around 14/1000 (UK at 10.7), the FR at 1.6 (UK 1.7) and the growth rate at 0.5%, (UK at 0.27%) and the momentum is slowing. This is due to a smaller number of woman of child bearing age 100 girls to 120 boys. (The natural ratio is about 105:100). This was recognised in 2004 when the government introduced its ‘Care for Girls’ plan. Farming families are to be offered incentives to stop the abortion of female fetuses. Girls will be exempt from school fees, while their parents will benefit from tax breaks, free insurance and extra housing.
Within urban areas children are benefiting from the one child policy; with no sibling competition they have a better education, a greater amount of attention. The parents have very high expectation for their children and therefore encouraging them to excel in school and in extra curricular activities.
Children in rural areas benefit as well, the policy has permitted children to go to school and receive a good education.
China has said it will drop its one-child policy for the parents of 9,000 children who died in the 2008 Sichuan earthquake Sichuan earthquake
Children in rural areas benefit as well, the policy has permitted children to go to school and receive a good education.
China has said it will drop its one-child policy for the parents of 9,000 children who died in the 2008 Sichuan earthquake Sichuan earthquake
By 2025 China will have to face a significant ageing population as the 1950s baby boomers reach old age and face the 4:2:1 issue. However the much improved economy should be able to assist these dependents although it is doubtful whether this would have been the case if the estimated 338 million extra mouths to feed had been born. By 2060 China’s population could be down to 800 million and their population pyramid could look like an MEDC entering Stage 5 of the DTM.
Overall the ‘one child policy’ highlights two points:
- A policy aimed at one objective can have unforeseen impacts elsewhere,
- If the policy continues for too long then it can be counterproductive.
Tuesday
Question Predictions
Population
- The way population change and migration affects the character of rural and urban areas
- demographic transition model
- The implications of Settlement case studies+ services
Health
- malnutrition, periodic famine, obesity.
- Contrasting health care approaches in countries at different stages of development.
- A local case study provision of health care systems
revision
Monday
How does Age gender and wealth affect access to exercise facilities, nutrition and health care ?
Age - nutrition
Some elderly people are
unable to provide themselves with adequately nutritious meals. This may be due
to physical difficulties affecting their ability to purchase food independently
and prepare it. They may require support from carers or services such as ‘Meals
on Wheels’ who deliver hot meals to people’s homes. If these services are
unavailable then old age can be a factor that affects access to nutrition.
Young people’s access to suitable nutrition can be affected by the level of
education they receive about health eating and the availability of good
nutrition in schools. Some schools have achieved a ‘Healthy Schools’ award in
the UK for providing a nutritious lunch time meal menu. Young people attending
these schools are more likely to have good nutrition.
age health care
Older people are more
likely to suffer from age-related diseases, such as cancer and heart disease.
Most regions of the UK have an ageing population. Local health services will
need to include: specialised wards, increased screening for age-related diseases,
more residential care homes and mobile health services to cope with the
increased immobilised elderly population. This is particularly important for
those in rural areas without family support. If such provision can be made then
old age should not have a negative effect on access to health care. Young
people need to be able to access services suitable for them (from asthma
clinics to sexual health clinics). Those attending school will benefit from
flexible appointment options in order to make sure they can easily access
health care services. Flexible hours are often important to those of working
age too.
age exercise
Elderly people are often
unable to conduct strenuous exercise and are likely to need slightly different
provisions to other age groups. Not all leisure centres provided these. Cost is
also an issue for members of the elderly population that may be living on low
pensions and it may limit them from certain activities. The same is true for
young people and families – their access to exercise facilities is highly
likely to be influenced by cost. Many schools provide extra sporting activities
at lunch times and after school.
Wealth
nutrition
All people need to be able
access nutritious foods easily( no matter what their level of income) in order
for wealth to have no negative effect on access to nutrition. Access can be affected
by the types of food shops within the area (value/mixed/expensive) and
provisions such as food banks and free school meals for people of a lower
wealth level.
health
In the UK a person’s level
of wealth should not restrict their access to health care. This is due to the
existence of the National
Health Service (NHS). Some people may choose to take out private health
insurance, giving them access to private facilities which can have shorter
waiting times and experts more easily available. Some employers offer private
health care but often it is wealthier people who use these services. In recent
years the British press has covered many stories of declining standards in NHS
health care. Standards appear to vary around the UK.
exercise
As previously mentioned, levels of
wealth can have a significant effect on access to exercise facilities.
Members of the public need to remember that exercise does not have to cost
money – walks, runs, bike rides, public play parks etc. Privately run leisure
centres (E.g. Virgin active) often have membership fees which can exclude
lower income residents. Local authority run leisure centres are often cheaper
but some people feel the quality of the service is lower.
|
Gender
nutrition
The issues mentioned above
apply to both genders. Males and females often have different attitudes towards
the importance of good nutrition.
health
The issues mentioned above
apply to both genders. Some health care services are specific to one gender.
E.g. females would benefit from easy access to breast screening and cervical
cancer screening facilities. New Mothers would benefit from access to maternal
health services such as anti-natal classes and breast feeding support groups.
Low availability of such services is likely to affect the health of these
groups. What about men?
exercise
The issues mentioned above apply
to both genders. Some leisure facilities have introduced ‘ladies only’ sessions
to encourage participation. Certain types of exercise are more popular with men
(e.g. football clubs, boxing gyms, weight-lifting) and some more popular with
women (e.g. aerobics classes, yoga). If there is not a variety of activities
for different gender based interests then gender could restrict access to
exercise facilities. Mothers traditionally take a greater role in child care.
Their access might be restricted if there are not crèche facilities for their
children to use whilst they exercise.
http://www.theatlantic.com/health/archive/2013/10/a-real-time-map-of-births-and-deaths/280609/
Wednesday
please watch standard deviation video in preparation for Friday lesson
Thursday 24 April
interquartile range and box and whisker plots (page 6)
tutorials
standard deviation
STANDARD DEVIATION :- describes the average amount by which the values in a data set vary from the mean for that set.
---> It indicates the amount of clustering around the mean; showing how much the values are clustered allows the analysis of data to be taken much further than simply measuring central tendency.
In a normal tendency:-
- 68% of the values lie within +/- 1 Standard Deviation (SD) of the mean
- 95% of the values lie within +/- 2 SD of the mean
- 99% of the values lie within +/- 3 SD of the mean
---> A low SD indicates a more clustered distribution. A higher SD indicates a more spread-out/dispersed distribution.
Wednesday 23 April
super website for revision
http://geographyas
might be useful for next Friday …….
support for interquartile range and box and whisker plots
http://www.bbc.co.uk/schools/gcsebitesize/maths/statistics/representingdata3hirev4.shtml
support for interquartile range and box and whisker plots
http://www.bbc.co.uk/schools/gcsebitesize/maths/statistics/representingdata3hirev4.shtml
Easter revsion
It is for GCSE but still good starting point...
http://www.bbc.co.uk/schools/gcsebitesize/geography/population/population_change_structure_rev1.shtml
no brothers or sisters .... what would it be like ?
too many people ?
AS Coastal Environments
Soft & Hard Engineering Local Examples
Check out this link to some local examples of soft & hard engineering strategies used on The Wirral. How effective have these methods been on protecting the coast? Please read and consider the following points:
- What would be the economic, environmental and social benefits of these schemes?
- Why have these schemes been implemented in these locations?
- What are the problems of these schemes being used?
Follow the link: http://geographyas.info/coasts/coastal-management/

Universal Health Care
https://www.youtube.com/watch?v=VQ3sHfYzcv8
Please watch and consider the following points before Friday's lesson
What is meant by the term universal health care?
What are the advantages of universal health care
coverage?
How
is China working towards universal health care coverage?
this is a super website … use it for revision / independent learning
http://thebritishgeographer.weebly.com/geography-of-health.html
Homework HIV /AIDS Mrs Blanchard's class
Managing HIV
Use the website above to explore the concept of Universal access
What are ARVs?
What impact have ARVs had on life expectancy ?
Identify the barriers to free access to ARVs - what other problems must be overcome for ARVs to be effective ?
Feb 4th
Background Reading/Research for Thursday
River Studies Fieldwork: North Wales
- Take a look at this document that we reviewed in our lessons this week. http://www.field-studies-council.org/media/244842/background_information_-_afon_nant_peris.pdf
- Remember: you MUST be at school by 6:15am on Thursday - go to bed earlier on Wednesday evening!
- Bring plenty of layers of warm clothes and waterproof layers too.
- And nice lunch!
Jan 21
Pre reading
read the following information as preparation for the unit on health
January 12
some stats about Cornwall
January 8
Have a look at these posters and decide how and why posters such as these are an effective way to affect a change in behaviour ...
http://www.pbs.org/wgbh/nova/earth/population-campaign.html
Now this record should be number 1 in the hip parade ……..
Extended independent homework task
Settlement Case Studies
This is due in after christmas holidays for both classes
- You will need to plan your homework time over this period
- Do not leave it all to the last week - you will struggle
- There are 3 key parts to the homework:
- The research on urban morphology (use the s cool website) the research on formby and then the essay
- The websites below should help you
(Remember Ravenmeols and Harrington are the two wards in Formby and these are the ones you must focus on)
http://www.s-cool.co.uk/gcse/geography/settlements/revise-it/urban-morphology
http://www.sefton.gov.uk/pdf/PERD%20Formby%20-%20Key%20Statistics.pdf
http://www.sefton.gov.uk/pdf/PERD%20Formby%20area%20profile%20-%20SWOT%20analysis.pdf
http://www.sefton.gov.uk/pdf/CfC_AreaProfileForCentralSefton.pdf
http://www.sefton.gov.uk/pdf/ER-Formby-Area-Committee-Profile-96KB.pdf
http://www.neighbourhood.statistics.gov.uk/dissemination/LeadAreaSearch.do?
a=7&r=1&i=1001&m=0&s=1329648275914&enc=1&areaSearchText=L373na&areaSearchType=14&extendedList=false&searchAreas=
Thanks to Callum C for spotting this link about changes to China's one child policy.....
http://population.sg/whitepaper/downloads/population-white-paper.pdf
The Singapore Government has released a paper with suggestions for how the country can deal with the challenges of its ageing and soon to be declining population.
(IMPORTANT) Read the conclusion in chapter 6 as it summarises the issues and what the Government has proposed to deal with the challenges of population change.
http://www.economist.com/debate/overview/151
Join in the population debate. Should we be creating policies to control population or not? Read about the issues on the link above. The debate may be finished on the website but bring your views to the classroom and we can continue the debate there.
http://www.bbc.co.uk/iplayer/episode/b03h8r1j/This_World_Dont_Panic_The_Truth_About_Population/
Statistician Professor Hans Rosling presents a spectacular portrait of our rapidly changing world, showing how the problems of rapid population growth are starting to be conquered.
monday's lesson
‘The population pyramid for England displayed the characteristics of a country in stage 4 until 2001, but the evidence of this stage is less clear in 2011.’
1. Provide evidence from: your pyramid for this statement (7)
Sunday
http://www.bbc.co.uk/news/business-23325043
How does this article link to a youthful population structure ?
Tuesday - this is a really important article
*******please read******
http://www.bbc.co.uk/news/uk-24813467
THURSDAY 7 NOVEMBER
The truth about populations
BBC 2 9 pm
Hans Rosling is back ...........
Test your knowledge of global ageing
http://www.theguardian.com/world/quiz/2009/jul/20/global-ageing-population
and a really useful document
http://image.guardian.co.uk/sys-files/Guardian/documents/2009/07/20/p95-09-1.pdf
Population pyramids
this is a fun graphic :)
http://www.worldlifeexpectancy.com/world-population-pyramid
extended homework ... Mrs Blanchard
Ageing population – INDEPENDENT ENQUIRY
(with specific reference to the UK)
- What is an ageing population?
- With Specific reference to the UK
Outline the economic and social impacts of an ageing population?
(Problems? Benefits? Other issues to consider?)
- Produce a case study of Ageing in East
Devon
- Produce a report on Ageing in China (use
weblink 5 only)
- Identify what may happen to Europe in
the future (weblink 6)
The websites below
will help get you started but you will also need to conduct your own research
- The work should be completed on
computer and should be between 4-6 sides of A4 including pop pyramids
where appropriate.
- Take care to reference all your work
by giving websites as either footnotes or an appendix
- Use of bullet points is fine – copy
and pasting is a waste of your time
- IDENTIFY A NUMBER OF QUESTIONS TO BE
ADDRESSED in Thursday's lesson
- To be handed in COMPLETED Friday 8th 2013
iplayer catch up opportunity
catch up with documentary shown on BBC 2 thursday 9pm
This World
This is part of a series all of which will help with your study of population
Homework 10 October
Apologies for my absence yesterday - however Hawkshead was fab and we had a lovely day in the lakes.
Thought you might need a little help with your homework...
Strengths of DTM
- all countries will fit model at some stage - refer to some examples
- model can change over time
- model can be a predictor with expectation that each country can progress through the stages of the model
- good basis to compare countries
- offers reasons for progression through the stages
- flexibility of time element is also a positive -increasing the degree of fit
- some countries in north western europe clearly fit the model and explain the changes that occurred there
- evidence base - north European and so fits W europe and N America better than anywhere else
- links to industrialisation and progression through the model make application in poorer countries more difficult
- timescales for stage 2 and 3 in poorer areas of world raise the question about progression through stages
- cause of change from 2 to 3 is also different in poorer countries
- role of population policies ignored
- original absence of stage 5 to take account of zero and negative growth
- migration is not taken into account
- areas with high rates of disease such as HIV/ AIDS not taken into account
Unit 2 Question 2 Samples
Aims, Objectives and Hypotheses
……briefly outline its aim and one hypothesis you sought to test (4)
……outline the aim(s) of your enquiry and state one hypothesis, research question, issue or problem you investigated (4)
……state its aim and one hypothesis that was tested (3)
……outline the aim of the study, state the study area and why it was a suitable location for your study (3)
……briefly outline the aim of the study (2)
…state its aim and the idea/ concept/ theory/model that underpins the aim (3)
……briefly outline its aim (2)
……briefly outline its aim and one hypothesis you sought to test. (3)
……briefly outline the purpose of the study (2)
……state the purpose of the study and identify the area studied and give a reason for the selection of this location.(4)
……briefly outline its aim (2)
……briefly outline its aim (2)
……outline the aim, one objective and the theory/ concepts that provided the idea for the study (4)
……Give the title and briefly outline its purpose (2)
……Give the title and state one factor that you considered important when selecting the study area. Say why this factor was important. (6)
Pre- Visits and Risk Assessments
Before visiting an area for fieldwork, a risk assessment must be completed.
......Outline the risks associated with carrying out your fieldwork and assess the effectiveness of strategies used to minimise the risks (5)
……State one risk to your safety in conducting the enquiry and one way in which you tried to minimise the risk (3)
……State one health and safety concern related to the data collection, describe briefly how it was minimised and briefly outline how the item of primary data was collected. (6)
……Incorporate in your answer (to data collection) an awareness of the risks to your safety and how you would minimise these (6)
……Outline one risk associated with the collection of your primary data and show how this risk was minimised (4)
……State two potential dangers/risks/hazards with your data collection and outline the steps that you would take to minimise them (6)
Data Collection/ Methodology
Reading list - if you are thinking about studying Geography at university you may wish to read some of the following:
….For one item of primary data you collected for the study describe the method of data collection. (5)
Earth Odyssey
|
M Hertsgaard
|
0349111812
|
Japan Quake:
|
Simon Saint
|
1907962344
|
The Earth
|
Richard Fortey
|
0002570014
|
The Map that Changed the World
|
Simon Winchester
|
0140280391
|
People Quake
|
Fred Pearce
|
1905811349
|
The Bottom Billion
|
Paul Collier
|
0195374636
|
Turning up the Heat
|
Fred Pearce
|
0586089152
|
When the Rivers Run Dry
|
Fred Pearce
|
1903010576
|
Change in the Weather
|
Philip Eden
|
0826479731
|
The Killing of the Countryside
|
Graham Harvey
|
0099736615
|
A Blue Print for a Safer Planet
|
Nicolas Stern
|
1847920379
|
Fast Food Nation
|
Eric Schlosser
|
0060938451
|
Blood River
|
Tim Butcher
|
009949280
|
The Road Home
|
Rose Tremain
|
0099478463
|
Touching the Void
|
Joe Simpson
|
0099771012
|
Solar Blue
|
Ronnie Walker
|
1854211447
|
Gaia
|
James Lovelock
|
0192860309
|
Salmon Fishing in Yemen
|
Paul Torday
|
0753821788
|
……For one item of primary data you collected for the study, briefly describe the method of data collection and assess its advantages and /or disadvantages
……For one item of primary data you have collected for the study outline the method of data collection and the usefulness of the data item in your fieldwork
…..For one item of primary data you collected for the study briefly outline the sampling strategy used and the method of data collection (6)
……For one item of primary data you collected for the study, outline the method used and justify the method selected. (3)
……State the number of study sites that you would have and how you would sample them. Justify both your sample size and sampling method. (7)
……For one item of primary data you collected for the study briefly outline how it was collected and the advantages of the methods used. (5)
…..Identify one item or primary data and one item of secondary data collected. For each outline the method of data collection and the usefulness of the item for your study.
……Describe how you collected the data required to test your hypothesis and show how you tried to ensure that the data were as accurate as possible (7)
……Outline the method used in the collection of one piece of primary data (2)
……Outline the nature of one item of primary data collected (2)
……For one item of primary data which was collected briefly state how it was collected, the sampling method used and the reasons for adopting this sampling method. (5)
……Identify one item of primary data that was collected. Outline the method of data collection and the importance of piloting in data collection. (6)
……Give one item of primary data and one item of secondary data collected and for each justify its selection with reference to your aim(s). (6)
Data Analysis/Application
Waking the giant
|
Bill McGuire
|
0199592268
|
Why nations fail
|
Acemoglu and Robinson
|
1846684293
|
Rivers: A Very Short Introduction
|
Nick Middleton
|
0199588678
|
Migration: Changing the World
|
Guy Arnold
|
0745329055
|
There Are Other Rivers
|
Alastair Humphreys
|
1467987395
|
The Land Grabbers
|
Fred Pearce
|
0807003247
|
Climate Wars
|
Harald Welzer
|
0745651453
|
How Bad Are Bananas?: The carbon footprint of everything
|
Mike Berners-Lee
|
0781846688911
|
Blood River: A Journey to Africa's Broken Heart
|
Tim Butcher
|
9780099494287
|
Map Addict: A Tale of Obsession, Fudge & the Ordnance Survey
|
Mike Parker
|
9780007351572
|
King Leopold's Ghost: A story of greed, terror and heroism
|
Adam Hochschild
|
978-1447211358
|
Chasing the Devil: On Foot Through Africa's Killing Fields
|
Tim Butcher
|
978-0099532064
|
The Vanishing Face of Gaia: A Final Warning
|
James Lovelock
|
978-0141039251
|
Health Issues in Geography
|
Dan Cowling and Bob Digby
|
978-1-84377-252-1
|
Bankrupt Britain: An atlas od social change
|
Dorling and Thomas
|
978-1-84742-747-2
|
Volcanoes, Earthquakes and Tsunamis: Teach Yourself
|
David Rothery
|
1444103113
|
Geology: The Key Ideas (Teach Yourself)
|
David Rothery
|
1444103121
|
Glacial Geology: Ice Sheets and Landforms
|
Matthew Bennett
|
0470516917
|
……Describe a method of data analysis that was used in your investigation and state the advantages of using that method (5)
……State how the item of primary data was processed and/or presented; and justify your choice of processing/ presentation technique. (6)
Data Presentation
.......describe one method of used for presenting data collected (5)
……describe one method used to present the data. Why did you choose this method? (4)
……describe a method of presentation that you used in your investigation and indicate how the chosen method was useful. (7)
……State how the item of primary data was processed and/or presented; and justify your choice of processing/ presentation technique. (6)
Summary/ Findings
……summarise the findings of your enquiry (5)
......how did your results help to improve your understanding of the topic or environment investigated?
River Quaggy Sustainable Management Scheme
Formation of meanders
Waterfall formation
Year 12 Easter Homework (Mr Wilson)

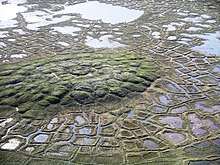
What are these mysterious markings in a periglacial environment?

Some key features in the periglacial section of cold environments...
Tuesday Lunchtime Revision for Unit 1 in C14 with Mr Brennan
AS Revision Workshops Easter 2013
For more information and online application visit www.lijm.ac.uk/picknmix-cpd
L6 Cold Environments: Homework Due Tuesday 5th March 2013
Write notes on the formation of a pyramidal peak and arete.


Have a read of this article linking climate change to glaciers..
L6 Cold Environment Half Term Homework
1 Reading task: Read through Intro to Cold Environments in textbook. Ensure you are sure of the meaning of key terms. (see below).
ablation ~ accumulation~ firn line~ sublimation~ snout~ surge~recede~ advance~ glacial budget~ net balance~ regelation zone~ basal slippage~ extending flow~ compressing flow~ pressure point melting~ crevasse~ moraine~ glacial till~ glacial lubrication~ internal flow
2 Research task: Find out the following;
How is a corrie formed?
How is a U shaped glacial trough formed?
What are Drumlins?
See you next week. Mrs S x
........................................................................................................................................................
Cross section of a valley glacier.


COLD ENVIRONMENTS...here we come!
Touching The Void Trailer (2003)...take a look.
Plenty of glacial features in the full length film.
Please watch the following link which describes why Bill Gates has decided to attempt to get the world to work together to help eradicate polio. This is especially relevant for the 'Health in World Affairs' section of the specification. (This is brand new 'cutting edge' Geography!!)
Please make notes on the lecture and select any other examples mentioned which highlight 'Health in World Affairs' – We will then discuss Thursday 31st period 3
http://www.bbc.co.uk/iplayer/episode/b01qfr6l/The_Richard_Dimbleby_Lecture_Bill_Gates_The_Impatient_Optimist/

What is channelisation?
Reducing the length of the channel by substituting straight cuts for a winding course is the only way in which the (effective) fall can be increased. This involves some loss of capacity in the channel as a whole, and in the case of a large river with a considerable flow it is very difficult to maintain a straight cut owing to the tendency of the current to erode the banks and form again a sinuous channel.
Thursday: Thank you for your files! I have added file feedback at the end of your work. Please take time to read the tips and act upon the targets set. As a whole I was very pleased. Well Done L6
Mrs S x
Sorry that the snow got the better of us!!...Have a productive weekend and email me if you have any questions (sruthslater@yahoo.co.uk).
Good luck on Monday x
Sunday:Some example answers/ tips...
Some questions that we were going to look at today;
1. Explain the geographical concept, process or theory that under pinned your fieldwork enquiry. (4 marks)
In order to investigate changes in various stream channel characteristics downstream, along the River Alun in North Wales, I established a hypothesis. In relation to the Bradshaw Model of downstream change we investigated whether bedload size would decrease downstream due to erosional processes. My hypothesis was; Bedload size decreases downstream...
2. How did you respond to the risks associated with undertaking your primary data collection? ( 4 marks)
Before undertaking our investigation I undertook a risk assessment of the area. This involved identifying all levels of risk on a scale from 1-5 (high to low). Once each risk was identified I repsponded to each risk in order to reduce the likelihood of the risk occuring and to reduce the impact should the risk occur. Examples of my risk assessment were; wearing appropriate footwear with a good grip to reduce the likelihood and impact of slipping on the river bank. Wearing rubber gloves when handling bedload to reduce the risk of contracting Weils disease and washing my hands before eating my lunch. I also ensured that my group was handling the field equipment with care to reduce the chance of injury e.g. carrying the ranging poles with the spike facing down.
3. With the aid of a sketch diagram, describe one technique that you used to present data in your enquiry. (6 marks)
N.B. To access level 2 here you must include a sketch. You coudl use a scattergraph shows the hypothesis on the y axis and sites on the x axis with a line of best fit - remember to include a title. You can guess the data really as the examiner will not know your results but make sure it gives the correct correlation!
Scattergraphs were used to represent the data relating to bedload size. I entered the data I collected by labelling the x axis with the site number and the y axis with the hypothesis variable. Once I marked each correlation on my scattergraph with a pencil cross I drew a line of best fit with a ruler to show equal numbers on either side. This would help me to identify any relationship between the two sets of data...
4. Outline and justify one method of data collection that you used in your enquiry.
(6 marks)
N.B. Remember to explain in detail how you went about investigating downstream change. It should be clearly desribed and explained so that the examiner could use your instructions to replicate the investigation with ease...
4. Making specific reference to your results, suggest how your enquiry could be improved. (5 marks)
To access level 2 you have to show how change would impact positively upon the investigation.
Can you identify any of your results which seem to work against a pattern? How could you produce more reliable results? How could you improve continuity? How could you improve the recording of results? How would these improvements impact results and conclusions?
Questions taken from January 2009 past paper.
Go to AQA to see other past papers and mark schemes.
Q1. SKILLS:Check out this video on drawing isolines..quite good.
Unit 2 Question 1 tips...on the 8 mark question ensure the you outline the issue/ use data from the figure AND most importantly...include your own comments on the pros and cons of the issue...even consider future impacts.
Mock II results excellent. Well done. Keep practising your skills section. Remember accuracy when completing any graph work and use data where you can.
Unit 2 Mock II Thursday 10th January 2013 period 3 please be prompt...
2013 Happy New Year People!
Having marked your Mock Paper I- I am very pleased...
Fancy another one on Thursday...Mock II???
Exam Date: Monday 21st January 2013 (pm)
Question 1 SKILLS
The first part of the exam will be set on one of the two compulsory core sections of the physical and human geography from unit 1. This first part of the paper will be based on a variety of resources relating to the topic selected.
Question 2 FIELDWORK
The second part of the exam will relate specifically to candidates’ own fieldwork and investigative research skills. The fieldwork undertaken by candidates should be linked to the content of the specification i.e. Rivers and Landforms.
Geographical Association 16-19 Competition- Deadline 14th December 2012
Any questions or concerns email: sruthslater@yahoo.co.uk
Read this weeks stories of Storms and Flooding in the UK...BBC NEWS

Join the GA go to http://www.geography.org.uk/login_join.asp and join as a concessionary student member!
Exam Date: Monday 21st January 2013 (pm)
Question 1 SKILLS
The first part of the exam will be set on one of the two compulsory core sections of the physical and human geography from unit 1. This first part of the paper will be based on a variety of resources relating to the topic selected.
Question 2 FIELDWORK
The second part of the exam will relate specifically to candidates’ own fieldwork and investigative research skills. The fieldwork undertaken by candidates should be linked to the content of the specification i.e. Rivers and Landforms.

Fieldwork Wednesday 17th October 2012
Meet in C14 at 08.15 for quick briefing.
Depart at 08.30
We should be back in Formby before 17.30!!!
Kit List:
Packed Lunch/ Drink
Wellington Boots
Rubber Gloves
Waterproof (Cagoule..for Hannah!)
Change of Clothes
Remember all permissiomn slips and consent forms should be in by Tuesday 16th October.
Can't wait....
Italy and fertility .....
Remember I asked you to think about why ???????
http://news.bbc.co.uk/1/hi/world/europe/4739154.stm
Fish rescued from breached Trent and Mersey Canal

Part of the Trent and Mersey Canal breached near Dutton. Read more..
AS Physical Geography
Take a look at the Hjulstrom Curve explained...
W/c 17th September
web page is:
http://www.prb.org/Publications/Datasheets/2011/world-population-data-sheet/data-sheet
Link for Mrs Slater's homework for case study past question...
due in next Tuesday
For any named drainage basin, explain the main processes operating within it.
(Marks available: 15)
Level 3: answers the question very well (detailed)
An answer at this level is likely to:
• display a detailed understanding of the topic
• make several points with support of appropriate exemplification and/or application of principle
• give a wide range of characteristics, reasons, attitudes, etc.
• provide highly detailed accounts of a range of case studies
• respond well to more than one command
• demonstrate evaluation, assessment and synthesis throughout
• demonstrate a sophisticated style of writing incorporating measured and qualified explanation and comment as required by the question and reflecting awareness of the complexity of subject matter and incompleteness/ tentativeness of explanation • demonstrate a clear sense of purpose so that the responses are seen to closely relate to the requirements of the question with confident use of specialist vocabulary • demonstrate legibility of text, and qualities of spelling, grammar and punctuation which contribute to complete clarity of meaning.
Homework Mrs Blanchard
w/c September 10th 2012
You have all been working really well to produce you presentations lets share some interesting facts about the Urban Micro-Climate
Sign up to Wall Wisher and start sharing your cool facts and ideas about what makes a good presentation with the class.
Welcome Year 12 Geographers 2012!
Looking forward to an exciting year...see you soon.
Lovely to have you back!
Good Luck tomo Y12
Where are your mocks Y12?
Need mocks Y12
One child policy...
Thanks for your mock Lydia - any others ??
some revision videos...
Mocks Y12 I've not received any for marking yet ??
Just a reminder that you have a mock on Wednesday in C14 starting at 1.30 2 hours
hope you can make it ...
super interactive atlas -Geographical Information systems at its best x
Swine Flu
How true is this??
Extended independent homework task
Settlement Case Studies
- This is due in in three weeks
- You will need to plan your homework time over this period
- Do not leave it all to the last week - you will struggle
- There are 3 key parts to the homework:
- The research on urban morphology (use the s cool website) the research on formby and then the essay
- The websites below should help you
- Remember Ravenmeols and Harrington are the two wards in Formby and these are the ones you must focus on
Club of Rome
brilliant link to club of rome and limits to growth to support this weeks homework
watch the video .........
Some really interesting facts ...
http://www.guardian.co.uk/news/datablog/2011/oct/28/mortality-statistics-causes-death-england-wales-2010#cause
Happy birthday world ... how many people were alive the day you were born ? ... Have a look at this website to find out: http://www.guardian.co.uk/environment/interactive/2011/oct/24/how-big-worlds-population-born
Happy birthday world ...population growth
May 4th
Here is a good link to help with your homework:
http://www.reuters.com/article/2010/01/14/us-pfizer-chantix-idUSTRE60D68920100114
Excellent health scattergraph (but what is he doing in the Dragons Den studio?)
Where are the most obese people in the UK ?
 (looks like Wales to me!)
CLimate Challenge game
Try playing this game where you are president of the European Nations. You must tackle climate change and stay popular enough with the voters to remain in office - a tricky balance :
http://www.bbc.co.uk/sn/hottopics/climatechange/climate_challenge/
MAPTUBE CHALLENGE
Hello year 12 this is your first challenge have a look at the website below and see who can come up with the most interesting map on health...
http://www.maptube.org/home.aspx
Cholera in Haiti

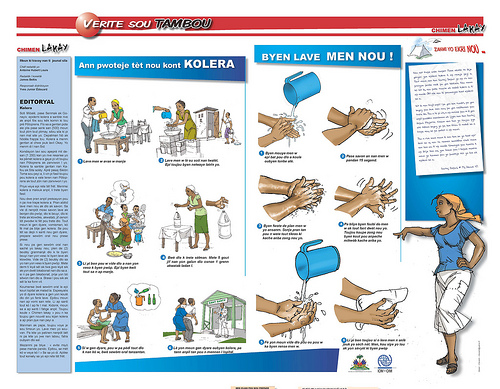 |
| Which poster would you find more informative! |
The Geography of an infectious disease : HIV

Have a look at the following websites